I’ve got GPX files and PowerTap exports from last weekend’s rides. After looking at things in WKO I kept asking myself the same thing, over and over… Yeah, but where was this? Maybe I’m just a map freak, or a visual person, and I know that power experts have learned to use speed/cadence/HR as cues, but…
…I wanna see power on the map.

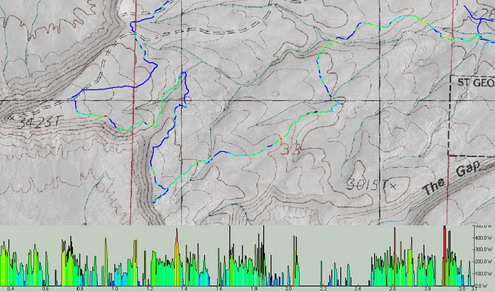
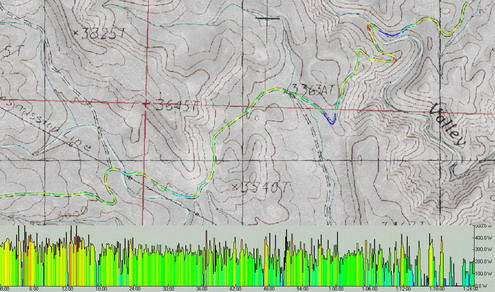
An input routine, some interpolation, squash a few bugs and voila! We have tracks shaded by power. Anything Red is 500W or higher, ranging down through the color wheel… orange, yellow, green and blue is coasting.
The trickiest issue (so far) is getting the offset right. For the above ride (Zen / Barrels) I started the powertap about 1 minute late. It’s a parameter that can be tweaked, but I have some reason to believe an automatic method of determining the offset will work.
The above ride was “chilling and drilling”, semi-technical riding with plenty of coasting. Below is a slice of the Blakes climb, with a little bit more consistent power.

Fun stuff. As usual in TopoFusion, you can move the mouse along the profile and get the current / cumulative stats and see the position move on the map. Great for understanding the ride.
“Why was I coasting there?? Weakling!”
Otherwise, convalescence is well underway. Hopping on my Leviathan was like slipping on a warm glove. Comfy to the max. Got out for ~2 hours of washes, bike paths and random trails. It felt great, but there was this empty feeling when I got back on the computer. All I’ve got is GPX data! Where’s my HR (no strap due to the injured rib)? Where’s my power????


Lucky for you, a PT with disc is on the way!
And how did you fit on Harris’ medium Lev?! Ack!
Very interesting! Maps with power- that’s something I’d really like to see more of.